As with almost all analytical techniques, there are applications that sound quite exotic at first glance, but upon closer inspection often prove to be almost more useful than the obvious ones.
Characterization of really unknown phases
This indeed occurs when new materials are developed for whose phases there are either no descriptions at all [1], or only insufficient ones, which can only be used to a very limited extent due to a lack of structural data.
a=5.90 Å b=5.88 Å c=14.74 Å c/a=2.504
α =90.2° β =89.6° γ =120.1°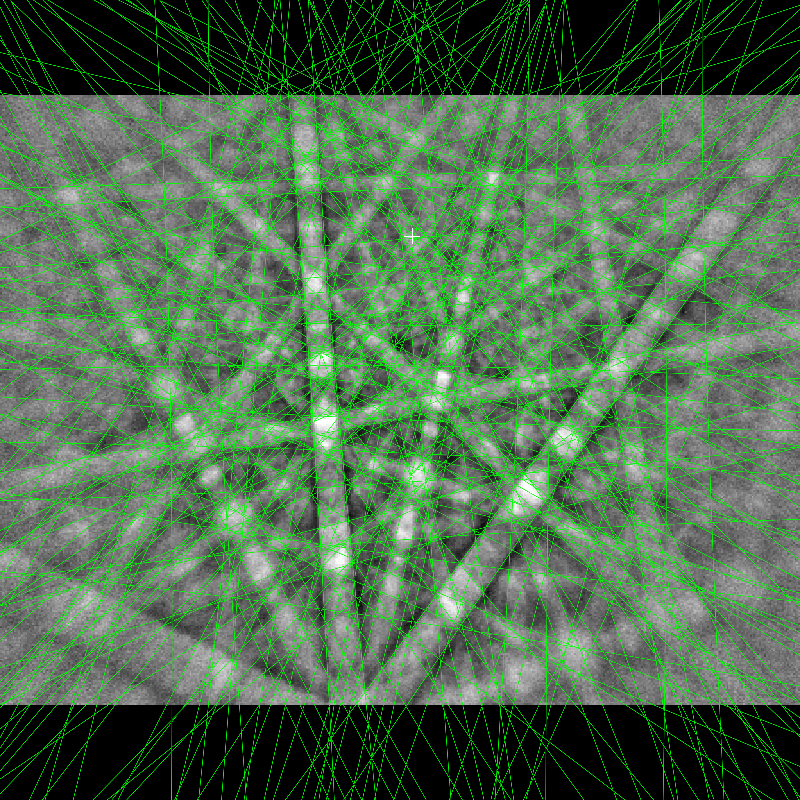
a=5.89 Å b=5.88 Å c=14.71 Å c/a=2.500
α =90.0° β =90.1° γ =120.0°
Please note: The characterization of unknown phases is not the solution, but only contributes to the solution, because even with this, only a first step is taken: the approximate description of the translation lattice.
[1] Martin, S., Walnsch, A., Nolze, G., Leineweber, A., Lèaux, F. & Scheuerlein, C.: The crystal structure of (Nb0.75Cu0.25)Sn2 in the Cu–Nb–Sn system. Intermetallics 80 (2017), 16 – 21
Unknown phase with known structure type
Much more frequently, individual precipitates or segregations occur in a microstructure which cannot be interpreted or can only be interpreted inadequately. If no phase with similar chemical composition is found in the available databases, the only option is to search for solutions with no or only partial chemical preference.
This is equivalent to searching for a phase with similar distribution of Kikuchi bands, hopefully leading to a phase with identical structure type. The search algorithms optimized for orientation determination are not particularly choosy in this respect, being satisfied already with approximate matches of the main bands in the Kikuchi pattern. However, the lattice parameter ratios for non-cubic phases will then not fit perfectly.
Please note: For such phases, the structural description of the phase with the same structure type are adopted, the elements are exchanged, and the lattice parameters are replaced with those determined in CALM.
This fits perfectly with the next example, which is from a Co-based alloy containing W. A Co-W phase occurred in a eutectic region for which no equivalent was found in any of the databases. By expanding the search to only Co-containing phases, a candidate was found that had striking similarities: β-Co3Ta. It consists of nine Co3Ta-layers with the stacking sequence ABABCBCAC. the structure is shown in the next image together with the known but not matching hexagonal phase Co3W and the cubic γ’-phase shown in the BSE images (a) below as grid-like feature embedded in the dark matrix phase.
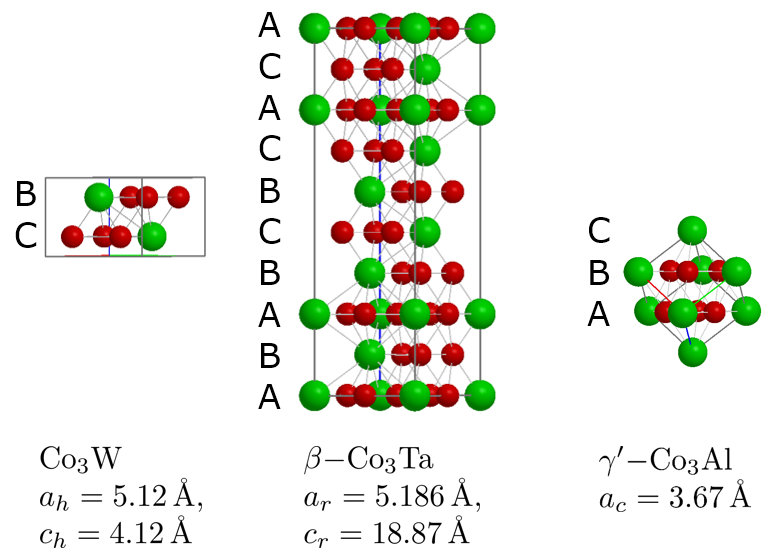
Similarities of hexagonal, rombohedral and cubic phases using the same layers but only a different stacking sequence. The lattice parameters are from databases.
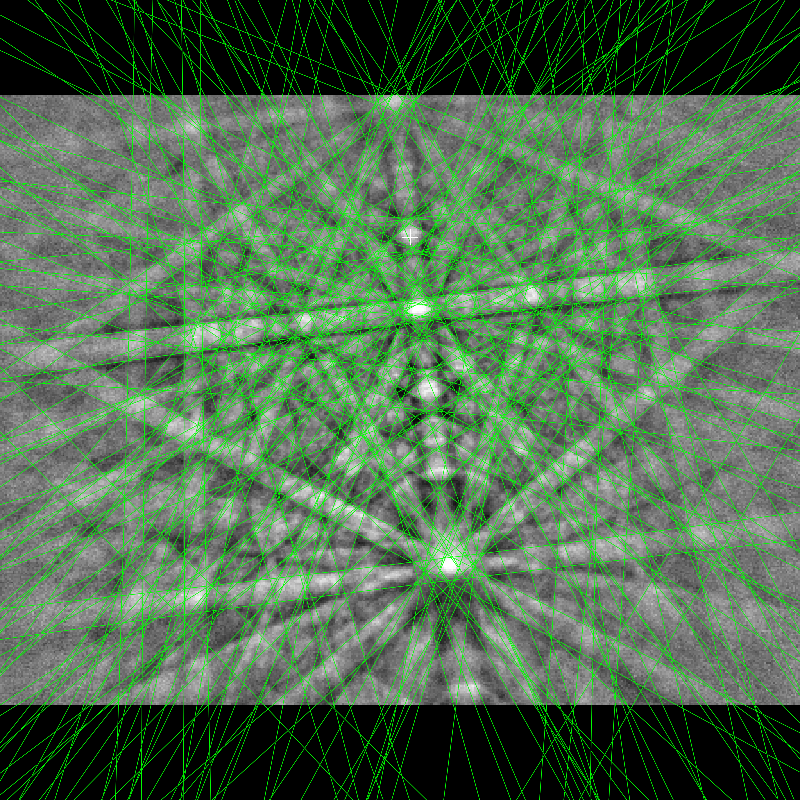
In the eutectic region – see image (a) below – adjacent patterns along the arrow drawn in red showed a very strange effect, cf. the pattern sequence in (b).
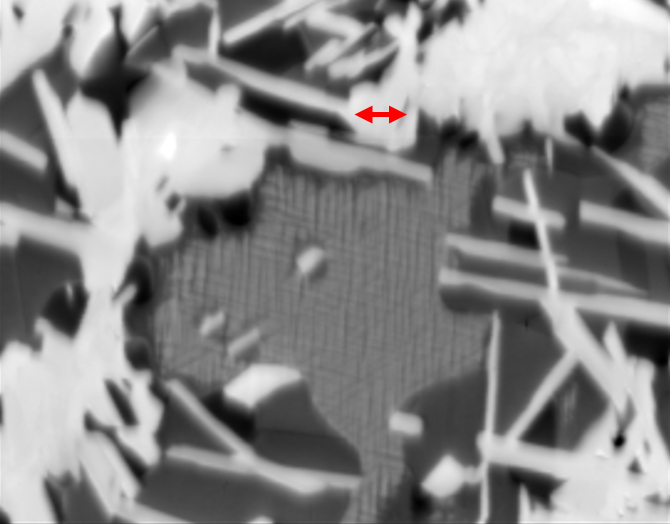
(a) BSE image of eutectic region 
(b) experimental pattern sequence 
(c) simulated sequence
At first glance, two diffraction patterns appear to be superimposed, however, the continuous preservation of shifting zone axes is an indication that certain parts of a lattice are preserved while others are continuously changed.
It is not easy to prove this model experimentally, but one can try to derive lattice parameters from the different Kikuchi patterns which fit to different stackings and then to specific stacking sequences. A promising result is shown in (c), which shows all band shifts satisfactorily and where also the intensities of the bands are well reproduced.
Lattice parameter adaptation
Anyone who works a lot with non-cubic phases will not rarely be faced with the problem of which of the often quite numerous phase descriptions should be included in the phase list?
Since the EBSD indexing software usually does not provide the identical hit rates for each of these candidates, it is not uncommon for multiple phase descriptions to be written into the phase lists to fake a high hit rate. Although the structural data can also lead to these differences, it cannot be completely ruled out that the chemical composition present in the phase in question does not correspond to that described in the database.
It may therefore be useful to check the lattice parameters on an experimental pattern and possibly adjust them.
A further, but then preferably automated, analysis concerns the investigation of gradient materials. This refers to crystalline materials in which the lattice parameters of non-cubic phases vary measurably. The driving force can be either chemical (diffusion, segregation) or physical (phase transformation). Preliminary experiments on a Ni-Mn-Ga transformation structure show that it gives similar results to pattern matching first reported in [2].
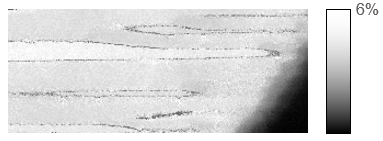
c/a variation after martensitic transformation in Ni-Mn-Ga. The pattern processed had a size of 622×512 pixels.
However, larger patterns were used in this test, which is also a reason for the limited size of the measurement field.
[2] Winkelmann, A.; Nolze, G.; Cios, G. & Tokarski, T.: Mapping of local lattice parameter ratios by projective Kikuchi pattern matching. Phys. Rev. Mater., 2 (2018) 123803
Discovery of non-matching bands
This describes a rather rare application, but it is worth mentioning. It does not concern orientation maps, but the analysis of individual bands in a single pattern, some of which are clearly visible, but do not fit the assumed phase.
This can be a simple residual overlap with another pattern, or it can also indicate structural causes (superstructure) or lattice defects (micro twinning, stacking faults).
The first case describes the situation that one or more bands do not fit the overall pattern in position (and then of course also not in width). The following diffraction pattern is a typical example. The right half shows some bands that fade the further you look to the left.
Two interferring patterns of corundum (Al2O3) with random orientations. Two strong bands are indicated by their edges.
The second case is more complicated, because band positions fit perfectly to a geometrically possible lattice plane. However, the bandwidth does not fit the lattice described so far, so CALM is forced to define a smaller reciprocal cell with often less symmetry.
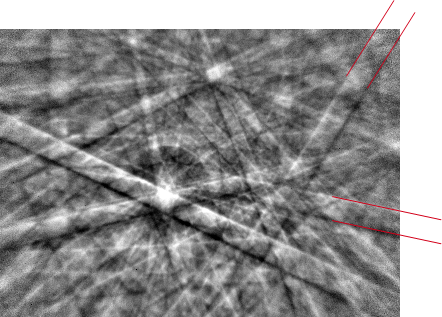
The example below is a pattern collected in a rock containing cubic ZnS. These extra bands might be formed by stacking faults whereas micro-twinning is not likely since then all other bands as from {111} planes – clearly visible by their designated polarity – should appear twice as well. In any case, the additional reciprocal lattice points force CALM to define a hexagonal sublattice. The volume of the hexagonal unit cell is 25% smaller compared to the cubic, but contains one lattice point (hP) compared to 4 (cF).
experiment and simulation 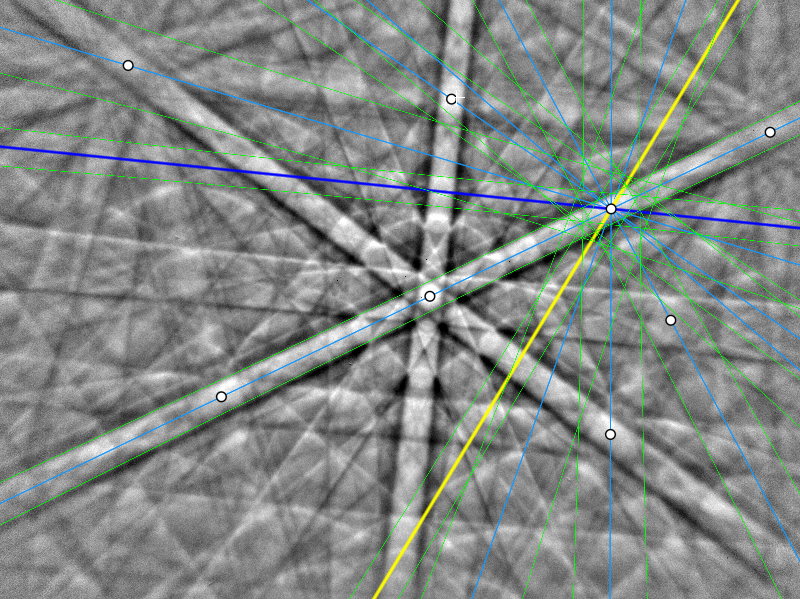
the blue and yellow marked traces do not match to ZnS 
5 additonal points change cF to hP
The resulting lattice parameters are a=3.876 Å and 9.505 Å.
The problem with such a pattern is that in case of an unknown phase there is nothing against the hexagonal description. Also not the fact that only a few or even one reciprocal lattice point makes this definition necessary, because the same happens for example with hematite. Also there it is often only a single intensity-poor band, which makes the correct solutions of the lattice possible. Practically all bands in hematite are related to a sublattice described by another set of basis vectors.
Image distortion tests
Studies of numerous experimental single patterns have shown that random image distortions occur much more frequently than we realize. Before performing a single-pattern analysis, it is therefore advisable to check whether the Kikuchi pattern exhibits deviations from a geometric projective representation. In other words, are there bands whose central lines are curved?
A distortion is very likely when the description of bands in CALM is impossible in the standard limits, or show systematic deviations in whole areas of the Funk transformation.
For the sake of simplicity, the superposition between an experimental pattern and its dynamically simulated counterpart for diopside – CaMg[Si2O6] – is shown.
Please note: For a lattice parameter analysis these are not devastating, but for a lattice distortion analysis they are.
Pseudosymmetry
Minimal distortions
It is surprising to realize how close some seemingly distinctive lattices often are in their description. Since not infrequently lattice vectors of one description do not match those of the other description, it is practically impossible to tell from the resulting angles or base vector lengths.
CALM gives these accordingly as solutions, if they are not obvious, like e.g. an actually tetragonal (pseudo-cubic) martensite lattice is described with cubic cell and not listed again as tetragonal cell.
There are a number of much more surprising examples than the trivial example of martensite, most of which can be made visible by increasing the maximum accepted deviations of lengths and angles in CALM for lattice analysis.
The animations change between a pseudo-cubic (cF, centered lattice points are darker) and the rhombohedral (hR, primitive cell) description. Only in the right animation it is recognizable that the angle between the cubic basis vectors are not exactly 90°.
Please note: Since CALM can only determine the probable lattice, the pseudo-symmetry is of course also limited to this. Purely structural pseudosymmetries are left out.
Overlooked bands
The discovery of as many as possible bands is important for the correct reciprocal lattice description, as the following example of hematite (Fe2O3) demonstrates:
Projection of the reciprocal lattice derived from a hematite pattern. From 66 bands 132+1=66*2+1 reciprocal lattice points are derived which deliver a cube-like lattice description (α=85.9°). Adding only the light-red colored lattice point, the reciprocal lattice is given by a unit cell with (α=55.4°).
However, even with a definition of 127 bands, only 4 indicate the correct description. The majority can also be described by a larger reciprocal unit cell.
Band profile analysis
As far as we know, CALM is currently the only software that can display and output profiles of experimental bands practically without distortion due to the optimal alignment of the band centers using the 4-line approach.
This enables the evaluation but first the understanding of band profiles, e.g. for anomalous broadening
(influence of dislocations, stacking faults), excess deficiency, verification of wavelength variations etc.
It could also provide the first steps towards approximating crystal structure determination using Kikuchi patterns, which of course needs to be verified by diffraction pattern simulation software. Conceivable applications are new materials such as high entropy alloys or phases with order/disorder phenomena.